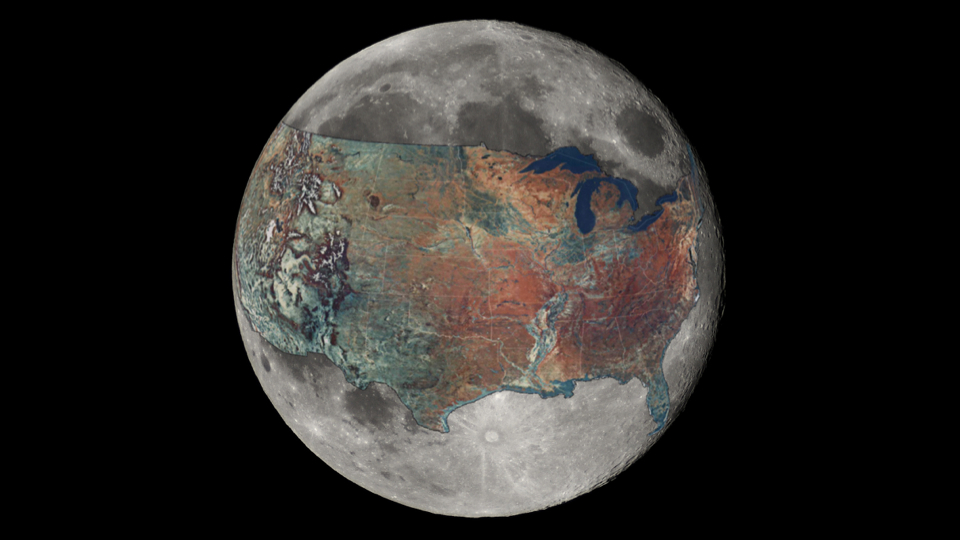
And now for a sense of scale: a map of the U.S. overlaid on the MoonThe greatest distance between two points within the contiguous U.S. is 2,892 miles, stretching from Point Arena, CA to West Quoddy Head, ME*. The circumference of the Moon is 6,784. To help put the scale of each into perspective, redditor boredboarder8 decided to overlay one on top of the other, giving rise to the approximation you see above. [Click here for hi-res] Writes boredboarder8:
We repeat: this is just a rough estimate, but it’s certainly good enough for government work when it comes to illustrating the Moon’s relative dinkiness. (Or America’s hulking hugeness, depending on how patriotic you’re feeling.) It’s strange — when we imagine objects in our solar system (even ones we know to be “small,” relative to other celestial bodies) I suspect that many of us regard them as just being unrelatably huge. They exist at scales so large, and at distances so vast, that numbers relating to mass, surface area and volume — descriptive though they may be — are rendered effectively meaningless. So it’s always nice when images like this come along that help put things into perspective, whether it’s a side-by-side comparison of all the water on Earth relative to the Earth itself, a figure illustrating there’s more water on Jupiter’s moon Europa than there is on Earth, or a map of the U.S. slapped across the Moon’s near-side.
|
Tag: Maps
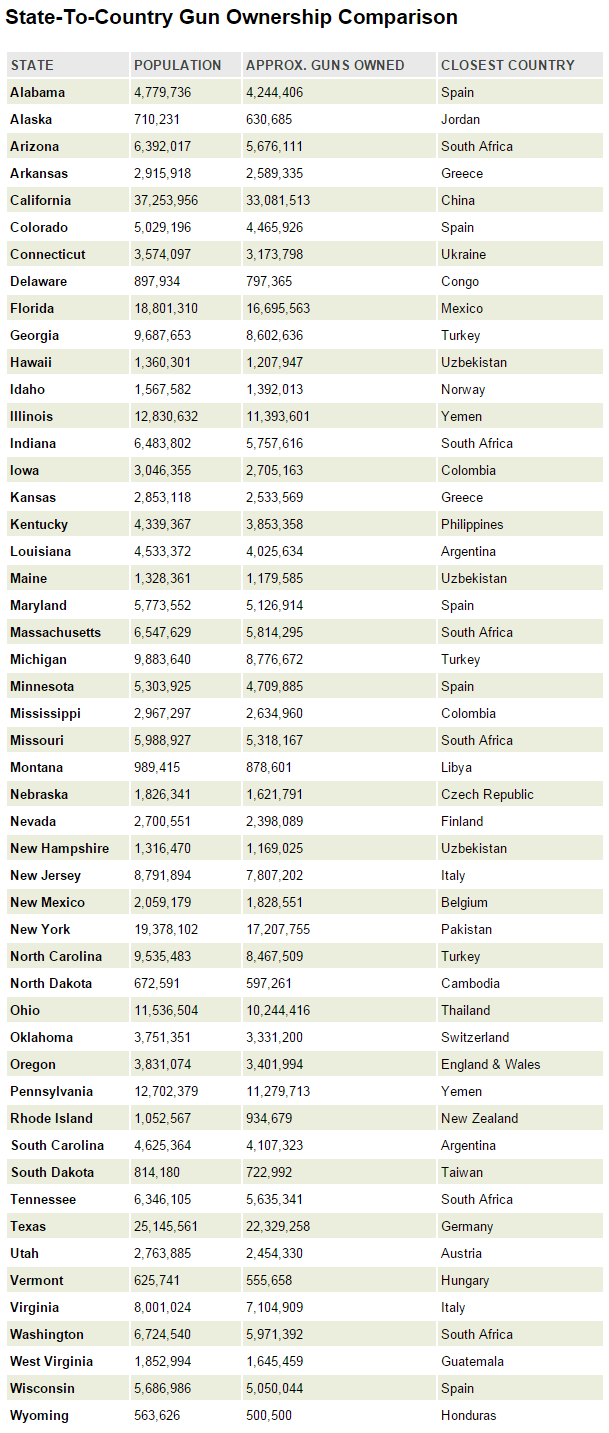
State To Country Gun Ownership Comparison
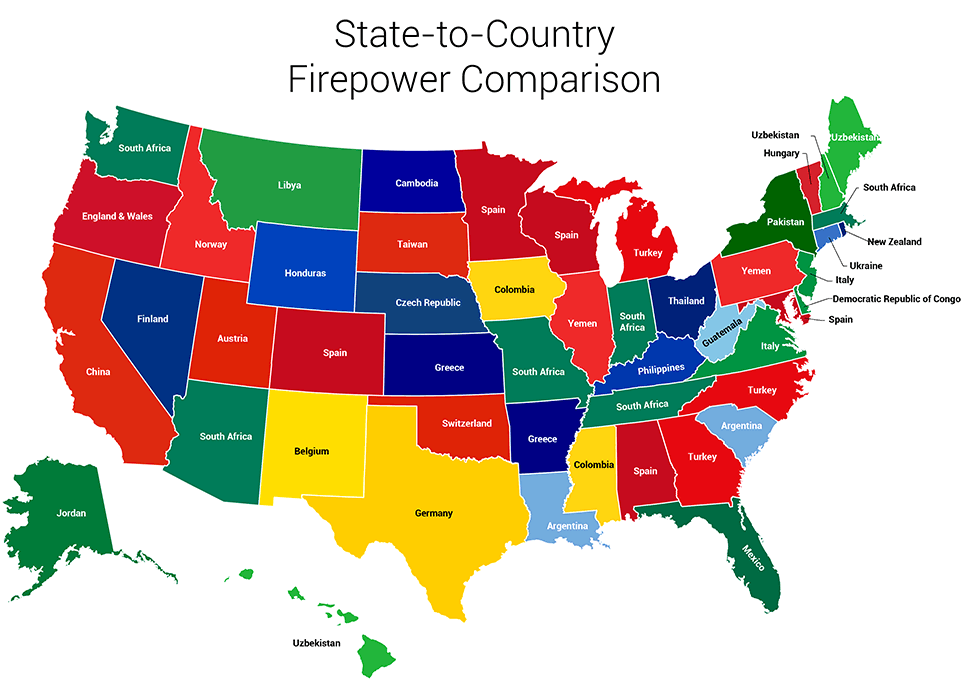
This map shows how all 50 States rank on gun ownership compared to nations around the world.
The Second Amendment of the United States Constitution states: “A well regulated Militia, being necessary to the security of a free State, the right of the people to keep and bear Arms, shall not be infringed.”
While it’s under constant debate whether having a passel of pistol-packing people is a help or hindrance to the security of our free State in 2015, there’s still a desire to make sure we’re protected should any need arise.
So, where do we stand in the “right to bear arms” discussion? Well, truth be told, we here at the Movoto Real Estate Blog would rather play with numbers and offer everyone an interesting perspective of the issue.
That said, what, we asked, would it look like if we compared gun ownership in our 50 states with gun ownership in other countries? You can see our answer above, and read about how we arrived at it below.
Methodology: What Triggered Our Conclusions
We started with a research group in Switzerland called Small Arms Survey and its report “Small Arms Survey 2007: Guns and the City.” Among other things, it estimated gun-ownership numbers for 178 countries, including the United States (which it estimates has about 270 million guns).
We then took the estimate of 88.8 guns per 100 people for the U.S.—which, seven years later, is likely higher—and used it to calculate each state’s estimated gun ownership, based on state populations from the U.S. Census Bureau’s 2010 survey. (Of course, gun-ownership density varies throughout the country, but this number gave us a easy way to come up with comparable figures for all 50 states, since actual state-to-state numbers were not available.)
Once we had the list of state numbers, we compared each one to Small Arms Survey’s list of countries and respective gun-ownership estimates, logging the nearest match.
Under The Gun: A Quick Peek At The Results
As you’d expect, the United States’ “superpowers” match up with some of the world’s superpowers:
- California’s total of 33.08 million guns is closest to China’s 40 million
- Texas’ total of 22.33 million guns is closest to Germany’s 25 million
- New York’s total of 17.2 million guns is closest to Pakistan’s 18 million
Interestingly enough, the next biggest state, Florida, is closest to Mexico (16.7 million vs. 15.5 million). Given their proximity, let’s hope they don’t meet in a shootout, because it probably won’t end like a proverbial Mexican Standoff.
The number of different countries on our comparison map is 32. (That number could have ended up higher, but we didn’t list multiple countries in the event of they were tied on the Small Arms Survey list.)
The countries with the most appearances on the list:
- South Africa: 6
- Spain: 5
- Uzbekistan: 3
- Turkey: 3
NUKEMAP
The nuclear bomb simulator that lets users nuke their home cities.
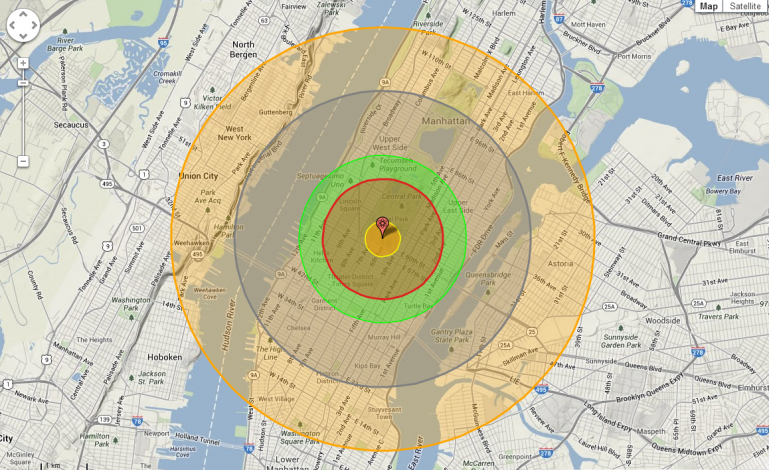
NUKEMAP is an interactive map using Google Maps API and unclassified nuclear weapons effects data, created by Alex Wellerstein, a historian of science at the Stevens Institute of Technology who studies the history of nuclear weapons. The initial version was created in February 2012, with major upgrades in July 2013, which enables users to model the explosion of nuclear weapons (contemporary, historical, or of any given arbitrary yield) on virtually any terrain and at virtually any altitude of their choice. A variation of the script, NUKEMAP3D, features rough models of mushroom clouds in 3D, scaled to their appropriate sizes. NUKEMAP3D doesn’t work on most browsers anymore for NPAPI plugins are no longer supported by them.
The computer simulation of the effects of nuclear detonations has been described both as “stomach-churning” (by Wellerstein himself) and as “the most fun I’ve had with Google Maps since… well, possibly ever” despite the admittedly abjectly grim nature of the subject. Originally intended in part as a pedagogical device to illustrate the stark difference in scale between fission and fusion bombs, more than three million people as of 2012 have exploded some 30 million virtual nuclear warheads; having gone viral, the increased popularity of the website necessitated a move to new servers. The website averages five “nukes” per visitor. According to the site’s own counter, in November 2016 users had simulated over 90 million nuclear explosions.
The NUKEMAP was a finalist for the National Science Foundation’s Visualization Challenge in 2014.
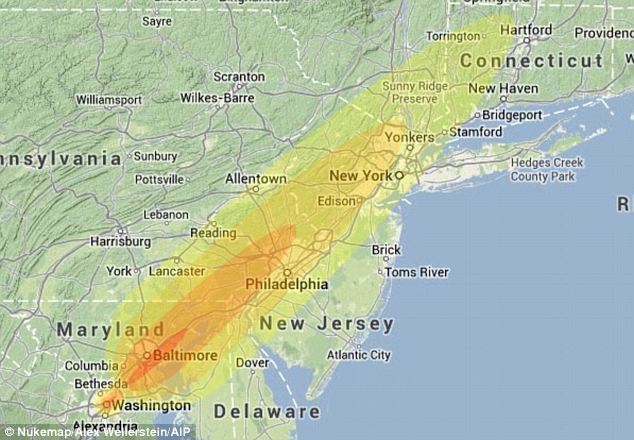
Users can select the location and size of the bombs.
The site shows the spread of the mushroom cloud including casualty numbers.
This map created by nuclear weapon historian Alex Wellerstein demonstrates the fallout caused by 2.3 megaton bomb dropped on Washington. It was modeled on the Soviet weapons held during the Cuban Missile Crisis of the 1960s
