Jul 062015
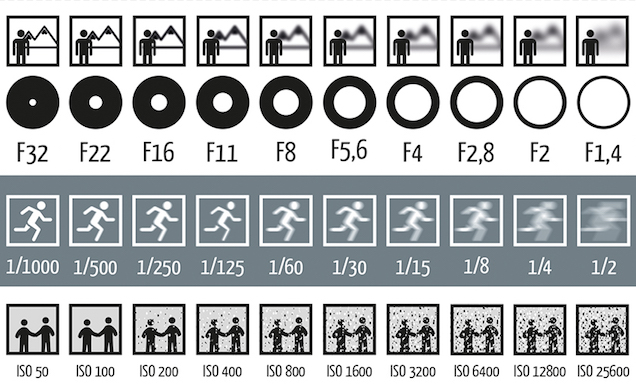
This chart shows how aperture, shutter speed, and ISO affect your photos.
Learning even just the basics of photography takes a bit of work and one of the more complex ideas is the relationship between ISO, aperture, and shutter speed. German photography blog Photoblog Hamburg has a graphic explaining how it works.
The graphic does a reasonable job at explaining how the amount of light you let it affects a photo, how certain settings can increase noise, and how focus changes. The top section represents aperture, the middle shutter speed, and the bottom ISO. It’s not a perfect representation of exactly what you’ll get, but it’s a nice visualization that helps you understand the basics.
Free download: Photo Cheat Card for Photographers

Sorry, the comment form is closed at this time.